
I had already reported on Bluesky the other day. It is portrayed in many places that it is more of a duet retreat. In fact, the percentage of German posts is in the single digits (thanks to Aurel Wünsch, who analysed this).
But how can one establish comparability? Since absolute numbers are difficult, let’s take an example from the local bubble: Here we have the „FotoVorschlag“ („photo suggestion“) who is active on X (aka Twitter), as well as on Bluesky. He posts a topic every day and those who are interested can then post a suitable picture of their own on the topic below it. What makes it exciting is that he posts at about the same time each day with the exact same text and hashtags (although these are „still“ unnecessary on Bluesky).
I have now looked at the posts over a period of time, starting a few weeks before the Bluesky account even started. But let’s start with the systematics:
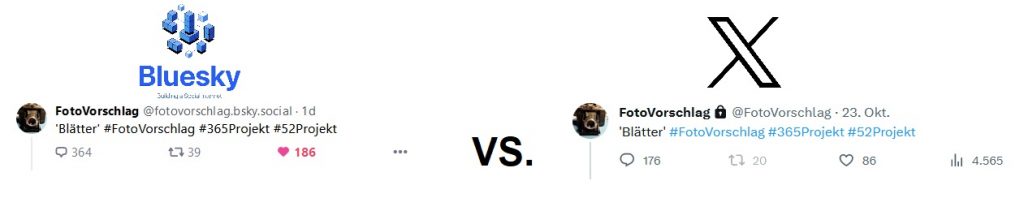
(Fun fact: Here you can see the similarities between Bluesky and X quite clearly) I have picked out two that Fotovorschlag published on Bluesky and X on 23.10.2023 respectively. Note: You can’t see the number of replies directly on Bluesky, but only in the search.
Now I have measured the interactions, i.e. how many likes, replies and responses the respective post has received. I calculated these numbers on two dates and they are therefore related to a specific date. If you check them today, they may be slightly different. As of yesterday, Fotovorschlag on X has put a lock in front of it, so a direct comparison is no longer possible. So I have finished the measurement with this.
Disclaimer: Yes, I know that the empirical relevance is manageable as only the „bubbles“ from the photo suggestion are compared here and no conclusion can be drawn about the totality.
Back to the numbers: In Excel it looks like this:
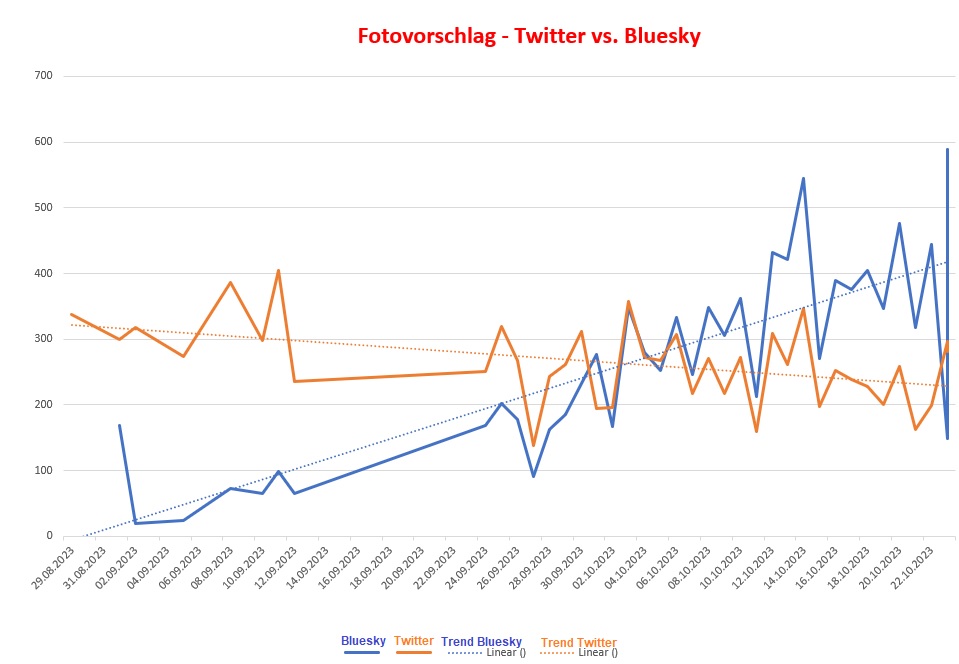
The outliers are exciting: If the highest value of interactions on X reached 402 (the sum of all replies, retweets (at that time) and likes), this peak value on Blueksy is 589. So you can see that in a very, very short period of time the interest has shifted a lot from the bubble of „photo suggestion“.
If anyone is interested in the Excel with the raw data, please contact me.
Here is the article in German.
Ein Gedanke zu „Bluesky and the german Bubble“